

 United Kingdom
 Germany
 Denmark
 Norway
 Sweden
 Italy
Italy Finland

Cisco-training
Insoft Services is een van de weinige aanbieders van opleidingen in EMEAR tot een volledige reeks van Cisco-certificering en gespecialiseerde technische opleiding aan te bieden.
Lees meer
Cisco-certificering
Ervaar een blended learning-aanpak die het beste van door een instructeur geleide training en e-learning in eigen tempo combineert om u te helpen zich voor te bereiden op uw certificeringsexamen.
Lees meer

Cisco Learning Credits
Cisco Learning Credits (CLCs) zijn prepaid trainingsvouchers die rechtstreeks bij Cisco worden ingewisseld en die het plannen van uw succes eenvoudiger maken bij de aankoop van Cisco-producten en -services.
Lees meer

Cisco Continuing Education
Het Cisco Continuing Education Program biedt alle actieve certificeringshouders flexibele opties om opnieuw te certificeren door een verscheidenheid aan in aanmerking komende trainingsitems te voltooien.
Lees meer

Cisco Digital Learning
Gecertificeerde medewerkers zijn GEWAARDEERDE activa. Verken de officiële Digital Learning Library van Cisco om uzelf te informeren via opgenomen sessies.
Lees meer

Cisco Business Enablement
Het Cisco Business Enablement Partner Program richt zich op het aanscherpen van de zakelijke vaardigheden van Cisco Channel Partners en klanten.
Lees meer

Cisco trainingscatalogus
Het Cisco Business Enablement Partner Program richt zich op het aanscherpen van de zakelijke vaardigheden van Cisco Channel Partners en klanten.
Lees meer
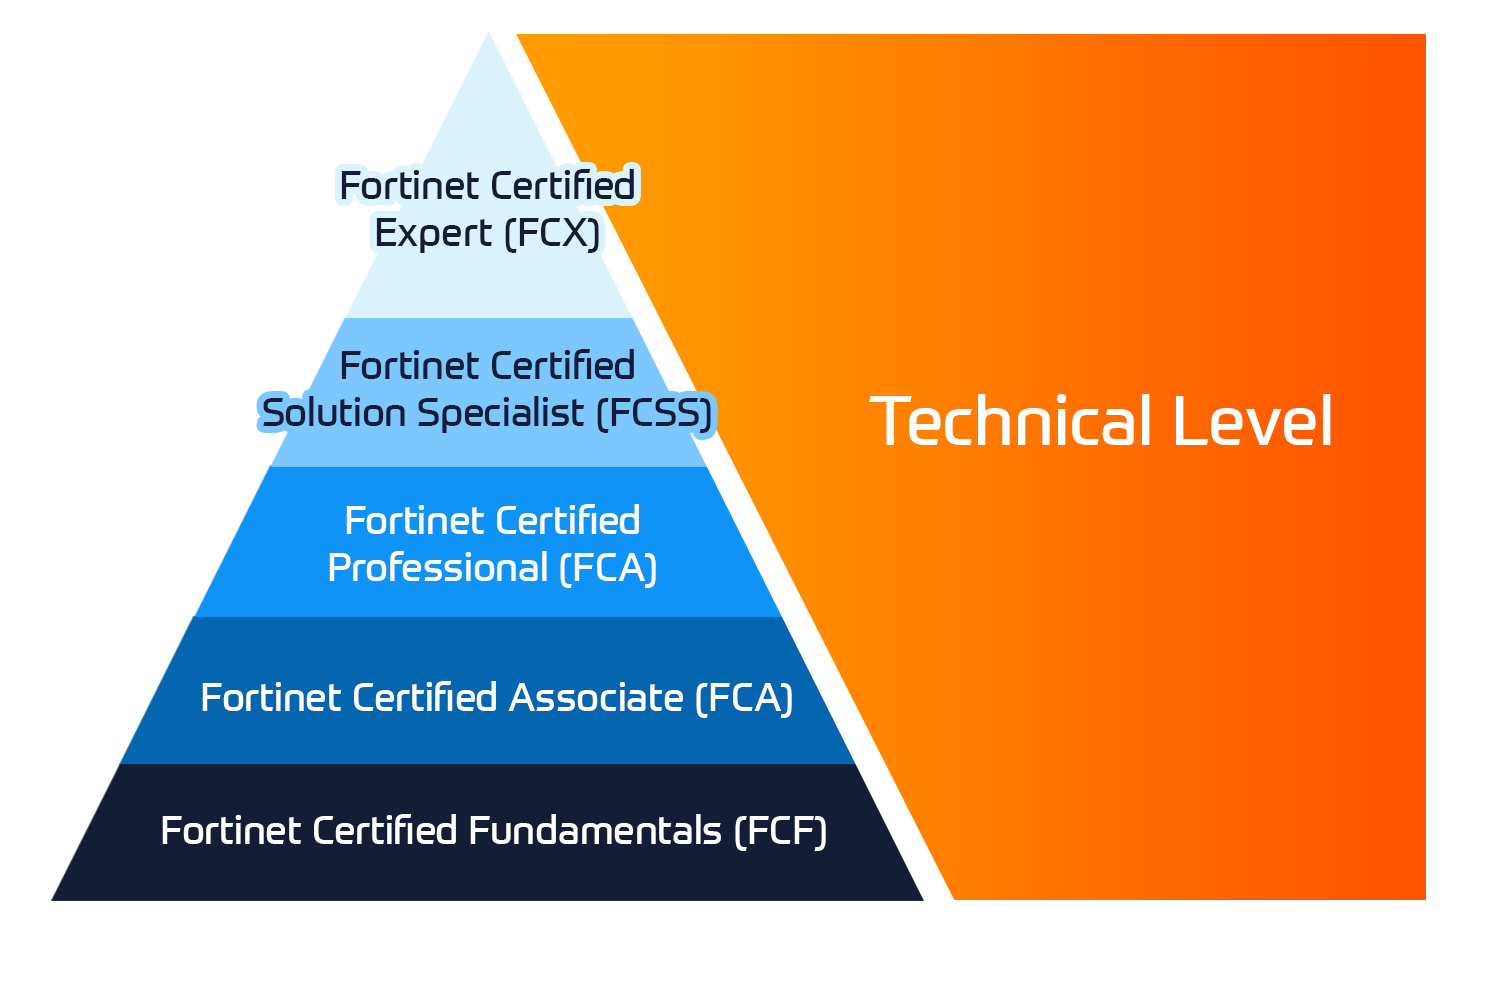
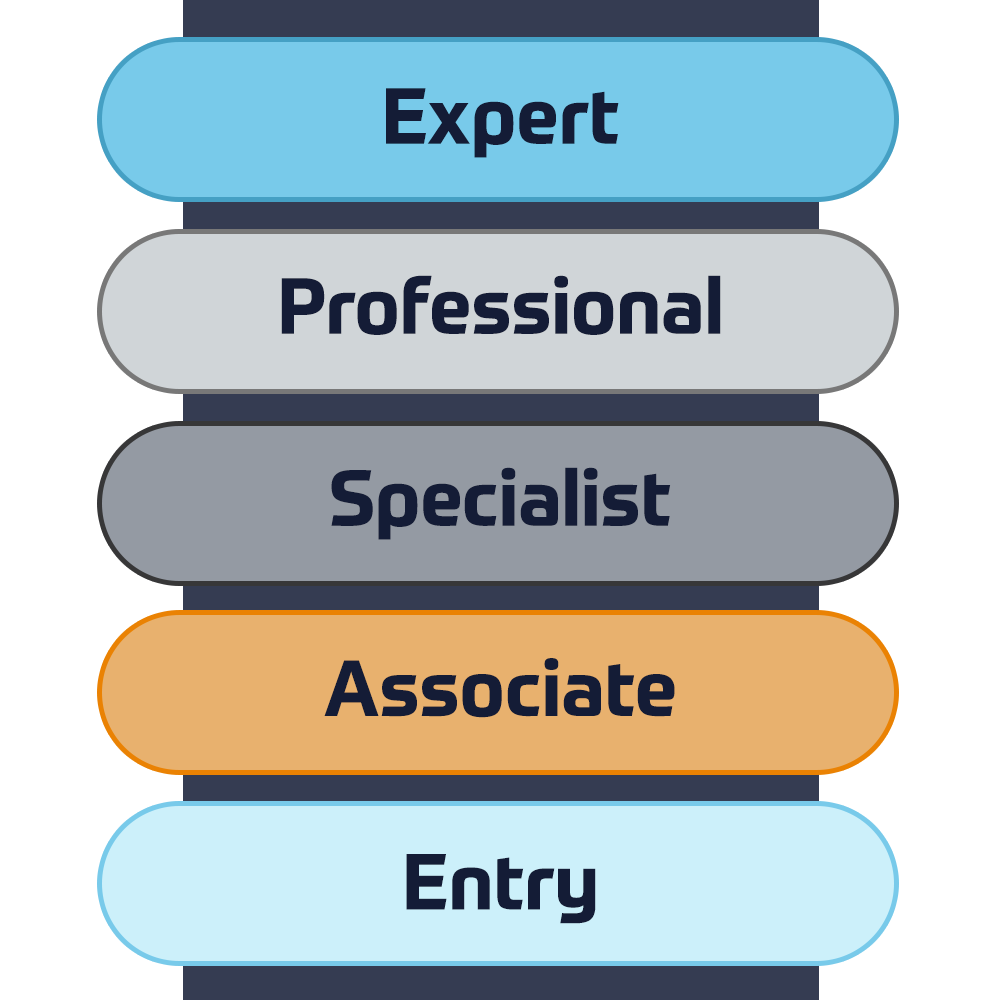
Fortinet-certificering
Het Fortinet Network Security Expert (NSE) -programma is een training- en certificeringsprogramma op acht niveaus om ingenieurs van hun netwerkbeveiliging te leren voor Fortinet FW-vaardigheden en -ervaring.
Technische trainingen

Fortinet-training
Insoft is erkend als Fortinet Authorized Training Center op geselecteerde locaties in EMEA.
Lees meer

Fortinet trainingscatalogus
Bekijk de volledige Fortinet trainingscatalogus. Het programma omvat een breed scala aan cursussen in eigen tempo en onder leiding van een instructeur.
Lees meer


Fortinet Professionele Services
Wereldwijd erkend team van gecertificeerde experts helpt u een soepelere overgang te maken met onze vooraf gedefinieerde consultancy-, installatie- en migratiepakketten voor een breed scala aan Fortinet-producten.
Lees meer

Microsoft-training
Insoft Services biedt Microsoft-trainingen in EMEAR. We bieden technische trainingen en certificeringscursussen van Microsoft aan die worden geleid door instructeurs van wereldklasse.
Technische cursussen

Extreme-training
Find all the Extreme Networks online and instructor led class room based calendar here.
Technische cursussen

Technische-certificering
We provide comprehensive curriculum of technical competency skills on the certification accomplishment.
Lees meer

Extreme trainingscatalogus
Leer uitzonderlijke kennis en vaardigheden van Extreme Networks
Lees meer

ATP accreditatie
Als geautoriseerde trainingspartner (ATP) zorgt Insoft Services ervoor dat u de hoogste onderwijsnormen krijgt die beschikbaar zijn.
Lees meer

Services Oplossingen
Wij bieden innovatieve en geavanceerde ondersteuning bij het ontwerpen, implementeren en optimaliseren van IT-oplossingen.Ons klantenbestand omvat enkele van de grootste Telco's ter wereld.
Oplossingen
Wereldwijd erkend team van gecertificeerde experts helpt u een soepelere overgang te maken met onze vooraf gedefinieerde consultancy-, installatie- en migratiepakketten voor een breed scala aan Fortinet-producten.


Over ons
Insoft biedt geautoriseerde trainings- en consultancydiensten voor geselecteerde IP-leveranciers. Ontdek hoe we een revolutie teweegbrengen in de industrie.
Lees meer
0G503G - Introduction to IBM SPSS Statistics (V22)
 Duration
2 Dagen
 Delivery
 (Online and onsite)
 Price
Price Price Upon Request
Introduction IBM SPSS Statistics
- Explain the basic steps of data analysis using IBM SPSS Statistics
- Describe the roles of the primary windows within IBM SPSS Statistics
- Describe the basic layout of IBM SPSS Statistics dialogue boxes
Reading Data
- Describe the choices on the File menu to read and save data files
- Read Excel files
- Read from an Access database
- Read delimited text files
Variable Properties
- Describe all the variable properties
- Define variable properties in the Variable View window
- Define variable properties using the Define Variable Properties dialogue
- Save variable properties with data in an IBM SPSS Statistics data file
- View variable properties interactively using Variables Utility
- View variable properties in tables using display Data Dictionary facility and Codebook procedure
Working with the Data Editor
- Define levels of measurement
- Use the Frequencies procedure to produce tables and charts appropriate to nominal variables
- Use the Frequencies procedure to produce tables and charts appropriate for ordinal variables
- Use the Frequencies procedure to produce tables and charts appropriate for scale variables
Modifying Data Values
- Use the features of Visual Binning to group a scale variable
- Use the features of Recode into a Different Variable for categorical variables
- Create new variables with numeric expressions
- Create new variables with conditional numeric expressions
Describing Relationships Between Variables
- Select the appropriate procedure to summarize the relationship between two variables
- Use the Crosstabs procedure to summarize the relationship between categorical variables
- Use the Means procedure to summarize the relationship between a scale and a categorical variable
Selecting Cases
- Describe and use the features of the Select Cases dialogue
- Describe and use the features of the Split File dialogue
Creating and Editing Charts
- Use the Chart Builder to create various types of graphs
- Format and edit the graph in the Chart Editor
Output in the Viewer
- Navigate through the Viewer
- Customize a pivot table
- Create and apply a template for a pivot table
- Export output to other applications
Syntax Basics
- Use the Syntax Editor environment
- Create Syntax
- Run syntax
- Edit syntax using auto-completion of commands
This basic course is for students with:
- Minimal experience in using IBM SPSS Statistics
Also, students that are:
- New to using a statistical package for data analysis
- Considering purchasing IBM SPSS
You should have:
- Experience using applications, such as word processors or spreadsheets, in the Microsoft Windows, Macintosh or Linux environment;
- Experience with IBM SPSS Statistics is not necessary, though a basic understanding of purpose and functions of the software is helpful.
No statistical background is necessary.
Follow Up Courses
-
3 DagenDatum op aanvraagPrice on RequestBook Now
-
3 DagenDatum op aanvraagPrice on RequestBook Now
-
5 DagenDatum op aanvraagPrice on RequestBook Now
-
5 DagenDatum op aanvraagPrice on RequestBook Now
-
3 DagenDatum op aanvraagPrice on RequestBook Now
-
4 DagenDatum op aanvraagPrice on RequestBook Now
-
5 DagenDatum op aanvraagPrice on RequestBook Now
-
5 DagenDatum op aanvraagPrice on RequestBook Now
-
4 DagenDatum op aanvraagPrice on RequestBook Now
-
2 DagenDatum op aanvraagPrice on RequestBook Now
 Schedule a Free Consultation