

 United Kingdom
 Germany
 Denmark
 Norway
 Sweden
 Italy
Italy Finland

Cisco-training
Insoft Services is een van de weinige aanbieders van opleidingen in EMEAR tot een volledige reeks van Cisco-certificering en gespecialiseerde technische opleiding aan te bieden.
Lees meer
Cisco-certificering
Ervaar een blended learning-aanpak die het beste van door een instructeur geleide training en e-learning in eigen tempo combineert om u te helpen zich voor te bereiden op uw certificeringsexamen.
Lees meer

Cisco Learning Credits
Cisco Learning Credits (CLCs) zijn prepaid trainingsvouchers die rechtstreeks bij Cisco worden ingewisseld en die het plannen van uw succes eenvoudiger maken bij de aankoop van Cisco-producten en -services.
Lees meer

Cisco Continuing Education
Het Cisco Continuing Education Program biedt alle actieve certificeringshouders flexibele opties om opnieuw te certificeren door een verscheidenheid aan in aanmerking komende trainingsitems te voltooien.
Lees meer

Cisco Digital Learning
Gecertificeerde medewerkers zijn GEWAARDEERDE activa. Verken de officiële Digital Learning Library van Cisco om uzelf te informeren via opgenomen sessies.
Lees meer

Cisco Business Enablement
Het Cisco Business Enablement Partner Program richt zich op het aanscherpen van de zakelijke vaardigheden van Cisco Channel Partners en klanten.
Lees meer

Cisco trainingscatalogus
Het Cisco Business Enablement Partner Program richt zich op het aanscherpen van de zakelijke vaardigheden van Cisco Channel Partners en klanten.
Lees meer
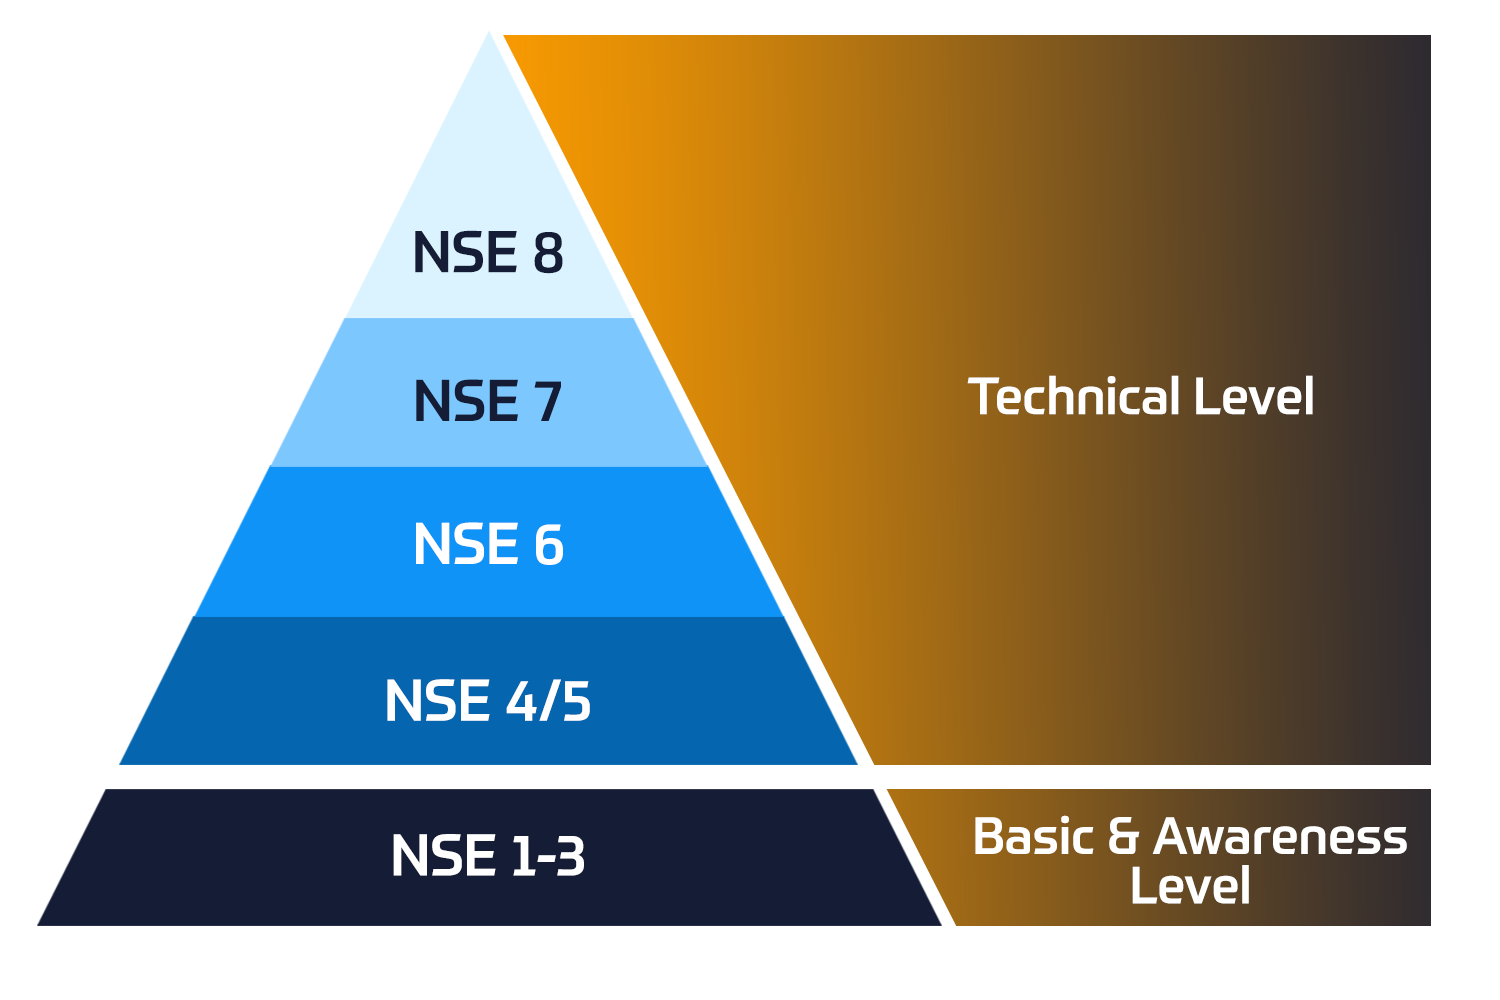
Fortinet-certificering
Het Fortinet Network Security Expert (NSE) -programma is een training- en certificeringsprogramma op acht niveaus om ingenieurs van hun netwerkbeveiliging te leren voor Fortinet FW-vaardigheden en -ervaring.
Technische trainingen

Fortinet-training
Insoft is erkend als Fortinet Authorized Training Center op geselecteerde locaties in EMEA.
Lees meer

Fortinet trainingscatalogus
Bekijk de volledige Fortinet trainingscatalogus. Het programma omvat een breed scala aan cursussen in eigen tempo en onder leiding van een instructeur.
Lees meer

Fortinet Professionele Services
Wereldwijd erkend team van gecertificeerde experts helpt u een soepelere overgang te maken met onze vooraf gedefinieerde consultancy-, installatie- en migratiepakketten voor een breed scala aan Fortinet-producten.
Lees meer

Microsoft-training
Insoft Services biedt Microsoft-trainingen in EMEAR. We bieden technische trainingen en certificeringscursussen van Microsoft aan die worden geleid door instructeurs van wereldklasse.
Technische cursussen

Extreme-training
Find all the Extreme Networks online and instructor led class room based calendar here.
Technische cursussen

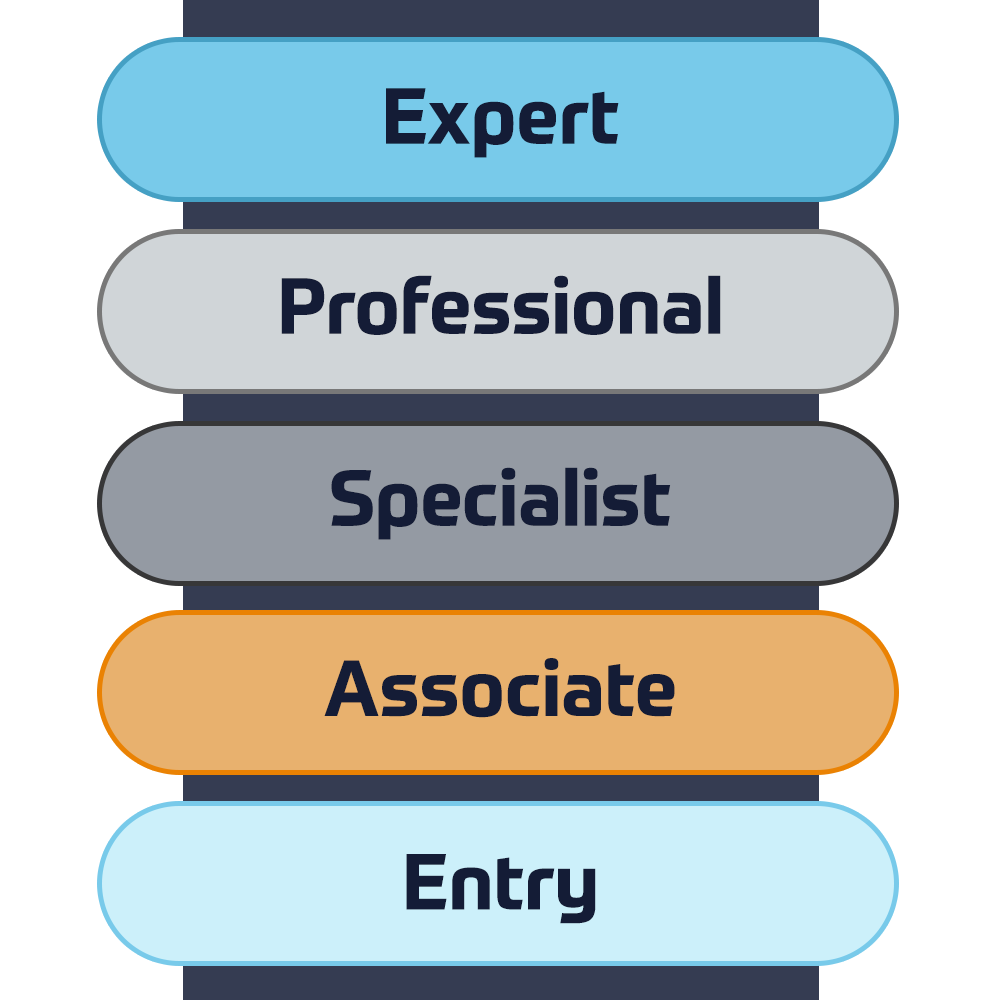
Technische-certificering
We provide comprehensive curriculum of technical competency skills on the certification accomplishment.
Lees meer

Extreme trainingscatalogus
Leer uitzonderlijke kennis en vaardigheden van Extreme Networks
Lees meer

ATP accreditatie
Als geautoriseerde trainingspartner (ATP) zorgt Insoft Services ervoor dat u de hoogste onderwijsnormen krijgt die beschikbaar zijn.
Lees meer

Services Oplossingen
Wij bieden innovatieve en geavanceerde ondersteuning bij het ontwerpen, implementeren en optimaliseren van IT-oplossingen.Ons klantenbestand omvat enkele van de grootste Telco's ter wereld.
Oplossingen
Wereldwijd erkend team van gecertificeerde experts helpt u een soepelere overgang te maken met onze vooraf gedefinieerde consultancy-, installatie- en migratiepakketten voor een breed scala aan Fortinet-producten.


Over ons
Insoft biedt geautoriseerde trainings- en consultancydiensten voor geselecteerde IP-leveranciers. Ontdek hoe we een revolutie teweegbrengen in de industrie.
Lees meer
Data Visualization with Python
 Duration
3 Dagen
 Delivery
 (Online and onsite)
 Price
Price Price Upon Request
Lesson One: Importance of data visualization and data exploration
- Topic 1: Introduction to data visualization and its importance
- Topic 2: Overview of statistics
- Activity 1: Compute mean, median, and variance for the following numbers and explain the difference between mean and median
- Topic 3: A quick way to get a good feeling for your data
- Topic 4: NumPy
- Activity 1: Use NumPy to solve the previous activity
- Activity 2: Indexing, slicing, and iterating
- Activity 3: Filtering, sorting, and grouping
- Â Topic 5: Pandas
- Activity 1: Repeat the NumPy activities using pandas, what are the advantages and disadvantages of pandas?
Lesson Two: All you need to know about plots
- Topic 1: Choosing the best visualization
- Topic 2: Comparison plots
- Line chart
- Bar chart
- Radar chart
- Activity 1: Discussion round about comparison plots
- Â Topic 3: Relation plots
- Scatter plot
- Bubble plot
- Heatmap
- Correlogram
- Activity 1: Discussion round about relation plots
- Â Topic 4: Composition plots
- Pie chart
- Stacked bar chart
- Stacked area chart
- Venn diagram
- Activity 1: Discussion round about composition plots
- Â Topic 5: Distribution plots
- Histogram
- Density plot
- Box plot
- Violin plot
- Activity 1: Discussion round about distribution plots
- Â Topic 6: Geo plots
- Topic 7: What makes a good plot?
- Activity 1: Given a small dataset and a plot, reason about the choice of visualization and presentation and how to improve it
Lesson 3: Introduction to NumPy, Pandas, and Matplotlib
- Topic 1: Overview and differences of libraries
- Topic 2: Matplotlib
- Topic 3: Seaborn
- Topic 4: Geo plots with geoplotlib
- Topic 5: Interactive plots with bokeh
Lesson 4: Deep Dive into Data Wrangling with Python
- Topic 1: Matplotlib
- Topic 2: Pyplot basics
- Topic 3: Basic plots
- Activity 1: Comparison plots: Line, bar, and radar chart
- Activity 2: Distribution plots: Histogram, density, and box plot
- Activity 3: Relation plots: Scatter and bubble plot
- Activity 4: Composition plots: Pie chart, stacked bar chart, stacked area chart, and Venn diagram
- Topic 4: Legends
- Activity 1: Adding a legend to your plot
- Topic 5: Layouts
- Activity 1: Displaying multiple plots in one figure
- Topic 6: Images
- Activity 1: Displaying a single and multiple images
- Topic 7: Writing mathematical expressions
Lesson 5: Simplification through Seaborn
- Topic 1: From Matplotlib to Seaborn
- Topic 2: Controlling figure aesthetics
- Activity 1: Line plots with custom aesthetics
- Activity 2: Violin plots
- Topic 3: Color palettes
- Activity 1: Heatmaps with custom colour palettes
- Topic 4: Multi-plot grids
- Activity 1: Scatter multi-plot
- Activity 2: Correlogram
Lesson 6: Plotting geospatial data
- Topic 1: Geoplotlib basics
- Activity: Plotting geospatial data on a map
- Activity: Choropleth plot
- Topic 2: Tiles providers
- Topic 3: Custom layers
- Activity: Working with custom layers
Lesson 7: Making things interactive with Bokeh
- Topic 1: Bokeh basics
- Topic 2: Adding Widgets
- Activity 1: Extending plots with widgets
- Topic 3: Animated Plots
- Activity 1: Animating information
Lesson 8: Combining what we’ve learned
- Topic 1: Recap
- Topic 2: Free exercise
- Activity 1: Given a new dataset, the students have to decide in small groups which data they want to visualize and which plot is best for the task.
- Activity 2: Each group gives a quick presentation about their visualizations.
Lesson 9: Application in real life and Conclusion of course
- Applying Your Knowledge to a Real-life Data Wrangling Task
- An Extension to Data Wrangling
Data Visualization with Python is designed for developers and scientists, who want to get into data science or want to use data visualizations to enrich their personal and professional projects.
You do not need any prior experience in data analytics and visualization, however, it’ll help you to have some knowledge of Python and familiarity with high school level mathematics. Even though this is a beginner level course on data visualization, experienced developers will be able to improve their Python skills by working with real-world data.
Hardware:
For the optimal student experience, we recommend the following hardware configuration:
- OS: Windows 7 SP1 32/64-bit, Windows 8.1 32/64-bit or Windows 10 32/64- bit, Ubuntu 14.04 or later, or macOS Sierra or later
- Processor: Dual Core or better
- Memory: 4GB RAM
- Storage: 10 GB available space software
- Browser: Google Chrome or Mozilla Firefox
- Conda
- JupyterLab and Jupyter Notebook
- Sublime Text (latest version), Atom IDE (latest version), or other similar text editor applications
- Python 3
- The following Python libraries installed: NumPy, pandas, Matplotlib, seaborn, geoplotlib, Bokeh, and squarify
Installation and Setup
- Before you start this course, we’ll install Python 3.6, pip, and the other libraries used throughout this course. You will find the steps to install them here.
Installing Python
- Install Python 3.6 following the instructions in this link: https://realpython.com/installing-python/
Installing pip
- To install pip, go to the following link and download the get-pip.py file: https://pip.pypa.io/en/stable/installing/
- Then, use the following command to install it: python get-pip.py
You might need to use the python3 get-pip.py command, due to previous versions of Python on your computer that already use the python command.
Installing libraries
Using the pip command, install the following libraries:
- python -m pip install -user numpy matplotlib jupyterlab pandas squarify
- bokeh geoplotlib seaborn
Working with JupyterLab and Jupyter Notebook
- You’ll be working on different exercises and activities in JupyterLab. These exercises and activities can be downloaded from the associated GitHub repository.
- Download the repository from here: https://github.com/TrainingByPackt/Data-Visualization-with-Python/
You can either download it using GitHub or as a zipped folder by clicking on the green Clone or download button on the upper-right side.
In order to open Jupyter Notebooks, you have to traverse into the directory with your terminal. To do that, type:
- cd Data-Visualization-with-Python/<your current lesson>
For example cd Data-Visualization-with-Python/lesson01/
To complete the process, perform the following steps:
- To reach each activity and exercise, you have to use cd once more to go into each folder, like so: cd Activity01
- Once you are in the folder of your choice, simply call jupyter-lab to start up JupyterLab. Similarly, for Jupyter Notebook, call jupyter notebook.
Importing Python Libraries
- Every exercise and activity in this course will make use of various libraries.
Importing libraries into Python is very simple and here’s how we do it:
- To import libraries, such as NumPy and pandas, we have to run the following code. This will import the whole numpy library into our current file: import numpy # import numpy
- In the first cells of the exercises and activities of this courseware, you will see the following code. We can use np instead ofnumpy in our code to call methods from numpy: import numpy as np # import numpy and assign alias np
- In later lessons, partial imports will be present, as shown in the following code. This only loads the mean method from the library: from numpy import mean # only import the mean method of numpy
Follow Up Courses
-
3 DagenDatum op aanvraagPrice on RequestBook Now
-
3 DagenDatum op aanvraagPrice on RequestBook Now
-
5 DagenDatum op aanvraagPrice on RequestBook Now
-
5 DagenDatum op aanvraagPrice on RequestBook Now
-
3 DagenDatum op aanvraagPrice on RequestBook Now
-
4 DagenDatum op aanvraagPrice on RequestBook Now
-
5 DagenDatum op aanvraagPrice on RequestBook Now
-
5 DagenDatum op aanvraagPrice on RequestBook Now
-
4 DagenDatum op aanvraagPrice on RequestBook Now
-
2 DagenDatum op aanvraagPrice on RequestBook Now
 Schedule a Free Consultation