Formazione Cisco

Insoft Services è uno dei pochi fornitori di formazione in EMEAR a offrire una gamma completa di certificazione Cisco e formazione tecnologica specializzata.

Dettagli

Certificazioni Cisco

Sperimenta un approccio di apprendimento misto che combina il meglio della formazione con istruttore e dell'e-learning autogestito per aiutarti a prepararti per l'esame di certificazione.

Dettagli

Cisco Learning Credits

I Cisco Learning Credits (CLC) sono voucher di formazione prepagati riscattati direttamente con Cisco che semplificano la pianificazione del successo durante l'acquisto di prodotti e servizi Cisco.

Dettagli

Formazione Continua

The Cisco Continuing Education Program offers all active certification holders flexible options to recertify by completing a variety of eligible training items.

Dettagli

Cisco Digital Learning

Certified employees are VALUED assets. Explore Cisco official Digital Learning Library to educate yourself through recorded sessions.

Dettagli

Cisco Business Enablement

The Cisco Business Enablement Partner Program focuses on sharpening the business skills of Cisco Channel Partners and customers.

Dettagli

Catalogo Cisco

Dettagli

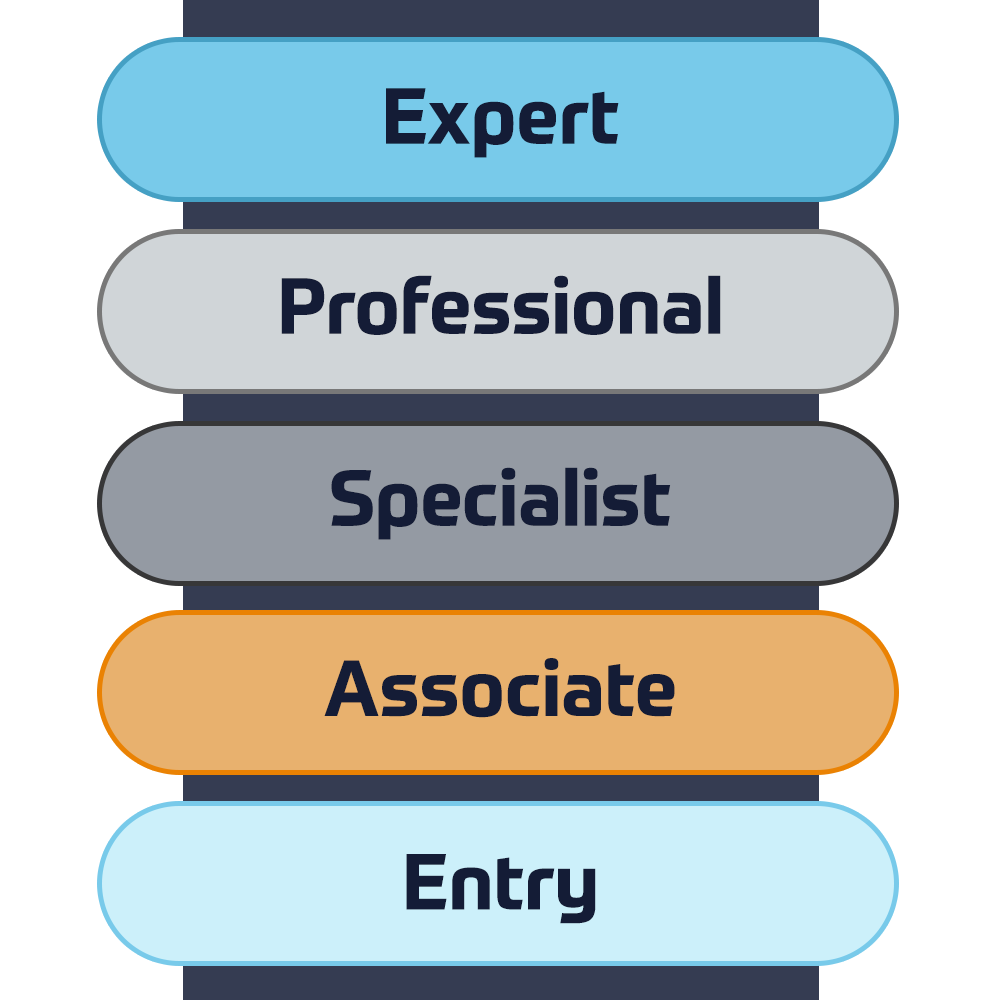
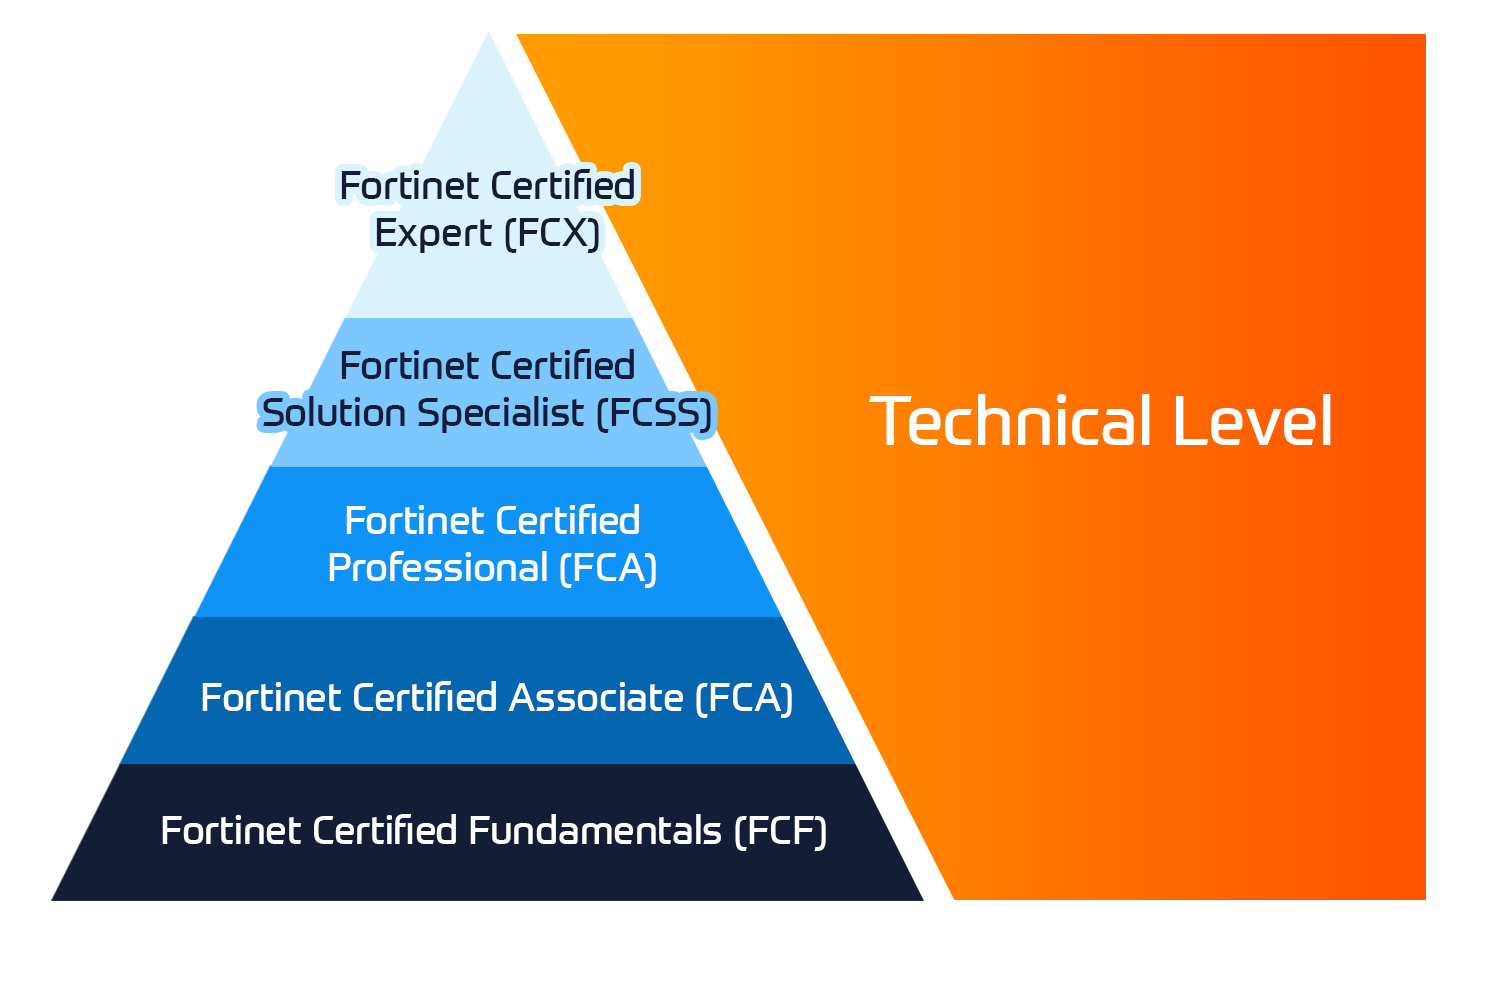
Certificazioni Fortinet

Il programma Fortinet Network Security Expert (NSE) è un programma di formazione e certificazione di otto livelli per insegnare agli ingegneri la sicurezza della loro rete per le competenze e l'esperienza di Fortinet FW.

Dettagli

Corsi di formazione tecnica

Insoft è riconosciuto come Fortinet Authorized Training Center in sedi selezionate in tutta l'EMEA.

Corsi tecnici

Catalogo Fortinet

Esplora un'ampia varietà di programmi Fortinet in diversi paesi e corsi online.

Dettagli

Stato ATC

Controlla il nostro stato ATC in tutti i paesi selezionati in Europa.

Dettagli

Fortinet Servizi Professionale

Il team riconosciuto a livello globale di esperti certificati ti aiuta a fare una transizione più fluida con i nostri pacchetti di consulenza, installazione e migrazione predefiniti per una vasta gamma di prodotti Fortinet.

Dettagli

Catalogo Microsoft

Insoft Services fornisce formazione Microsoft in EMEAR. Offriamo corsi di formazione tecnica e certificazione Microsoft guidati da istruttori di livello mondiale.

Corsi tecnici

Corsi di formazione

Impara conoscenze e abilità eccezionali di Extreme Networks.Find all the Extreme Networks online and instructor led class room based calendar here.

Corsi tecnici

Certificazioni Extreme

Forniamo un curriculum completo di competenze tecniche sul conseguimento della certificazione.

Dettagli

Catalogo Extreme

Dettagli

Accreditamento ATP

In qualità di partner di formazione autorizzato (ATP), Insoft Services garantisce che tu riceva i più alti standard di istruzione disponibili.

Dettagli

Pacchetti di consulenza

Forniamo un supporto innovativo e avanzato per la progettazione, l'implementazione e l'ottimizzazione delle soluzioni IT.La nostra base di clienti comprende alcune delle più grandi telco a livello globale.

Soluzioni & Servizi

Il team riconosciuto a livello globale di esperti certificati ti aiuta a fare una transizione più fluida con i nostri pacchetti di consulenza, installazione e migrazione predefiniti per una vasta gamma di prodotti Fortinet.

Chi siamo

Insoft fornisce servizi di formazione e consulenza autorizzati per fornitori IP selezionati.Scopri come stiamo rivoluzionando il settore.

Dettagli
  • +39 02 8704 5199
  • Data Visualization with Python

    Duration
    3 Giorni
    Delivery
    (Online e in loco)
    Price
    Prezzo su richiesta
    With so much data being continuously generated, developers with a knowledge of data analytics and data visualization are always in demand. With Data Visualization with Python, you'll learn how to use Python with NumPy, Pandas, Matplotlib, and Seaborn to create impactful data visualizations with real-world, public data. This Data Visualization with Python course takes a hands-on approach to the practical aspects of using Python to create effective data visuals. It contains multiple activities that use real-life business scenarios for you to practice and apply your new skills in a highly relevant context.  

    Lesson One: Importance of data visualization and data exploration

    • Topic 1: Introduction to data visualization and its importance
    • Topic 2: Overview of statistics
      • Activity 1: Compute mean, median, and variance for the following numbers and explain the difference between mean and median
    • Topic 3: A quick way to get a good feeling for your data
    • Topic 4: NumPy
      • Activity 1: Use NumPy to solve the previous activity
      • Activity 2: Indexing, slicing, and iterating
      • Activity 3: Filtering, sorting, and grouping
    •  Topic 5: Pandas
      • Activity 1: Repeat the NumPy activities using pandas, what are the advantages and disadvantages of pandas?


    Lesson Two: All you need to know about plots

    • Topic 1: Choosing the best visualization
    • Topic 2: Comparison plots
      • Line chart
      • Bar chart
      • Radar chart
      • Activity 1: Discussion round about comparison plots
    •  Topic 3: Relation plots
      • Scatter plot
      • Bubble plot
      • Heatmap
      • Correlogram
      • Activity 1: Discussion round about relation plots
    •  Topic 4: Composition plots
      • Pie chart
      • Stacked bar chart
      • Stacked area chart
      • Venn diagram
      • Activity 1: Discussion round about composition plots
    •  Topic 5: Distribution plots
      • Histogram
      • Density plot
      • Box plot
      • Violin plot
      • Activity 1: Discussion round about distribution plots
    •  Topic 6: Geo plots
    • Topic 7: What makes a good plot?
      • Activity 1: Given a small dataset and a plot, reason about the choice of visualization and presentation and how to improve it


    Lesson 3: Introduction to NumPy, Pandas, and Matplotlib

    • Topic 1: Overview and differences of libraries
    • Topic 2: Matplotlib
    • Topic 3: Seaborn
    • Topic 4: Geo plots with geoplotlib
    • Topic 5: Interactive plots with bokeh


    Lesson 4: Deep Dive into Data Wrangling with Python

    • Topic 1: Matplotlib
    • Topic 2: Pyplot basics
    • Topic 3: Basic plots
      • Activity 1: Comparison plots: Line, bar, and radar chart
      • Activity 2: Distribution plots: Histogram, density, and box plot
      • Activity 3: Relation plots: Scatter and bubble plot
      • Activity 4: Composition plots: Pie chart, stacked bar chart, stacked area chart, and Venn diagram
    • Topic 4: Legends
      • Activity 1: Adding a legend to your plot
    • Topic 5: Layouts
      • Activity 1: Displaying multiple plots in one figure
    • Topic 6: Images
      • Activity 1: Displaying a single and multiple images
    • Topic 7: Writing mathematical expressions


    Lesson 5: Simplification through Seaborn

    • Topic 1: From Matplotlib to Seaborn
    • Topic 2: Controlling figure aesthetics
      • Activity 1: Line plots with custom aesthetics
      • Activity 2: Violin plots
    • Topic 3: Color palettes
      • Activity 1: Heatmaps with custom colour palettes
    • Topic 4: Multi-plot grids
      • Activity 1: Scatter multi-plot
      • Activity 2: Correlogram


    Lesson 6: Plotting geospatial data

    • Topic 1: Geoplotlib basics
      • Activity: Plotting geospatial data on a map
      • Activity: Choropleth plot
    • Topic 2: Tiles providers
    • Topic 3: Custom layers
      • Activity: Working with custom layers


    Lesson 7: Making things interactive with Bokeh

    • Topic 1: Bokeh basics
    • Topic 2: Adding Widgets
      • Activity 1: Extending plots with widgets
    • Topic 3: Animated Plots
      • Activity 1: Animating information


    Lesson 8: Combining what we’ve learned

    • Topic 1: Recap
    • Topic 2: Free exercise
      • Activity 1: Given a new dataset, the students have to decide in small groups which data they want to visualize and which plot is best for the task.
      • Activity 2: Each group gives a quick presentation about their visualizations.


    Lesson 9: Application in real life and Conclusion of course

    • Applying Your Knowledge to a Real-life Data Wrangling Task
    • An Extension to Data Wrangling

    Data Visualization with Python is designed for developers and scientists, who want to get into data science or want to use data visualizations to enrich their personal and professional projects.

    You do not need any prior experience in data analytics and visualization, however, it’ll help you to have some knowledge of Python and familiarity with high school level mathematics. Even though this is a beginner level course on data visualization, experienced developers will be able to improve their Python skills by working with real-world data.

    Hardware:

    For the optimal student experience, we recommend the following hardware configuration:

    • OS: Windows 7 SP1 32/64-bit, Windows 8.1 32/64-bit or Windows 10 32/64- bit, Ubuntu 14.04 or later, or macOS Sierra or later
    • Processor: Dual Core or better
    • Memory: 4GB RAM
    • Storage: 10 GB available space software
    • Browser: Google Chrome or Mozilla Firefox
    • Conda
    • JupyterLab and Jupyter Notebook
    • Sublime Text (latest version), Atom IDE (latest version), or other similar text editor applications
    • Python 3
    • The following Python libraries installed: NumPy, pandas, Matplotlib, seaborn, geoplotlib, Bokeh, and squarify


    Installation and Setup

    • Before you start this course, we’ll install Python 3.6, pip, and the other libraries used throughout this course. You will find the steps to install them here.


    Installing Python


    Installing pip

    You might need to use the python3 get-pip.py command, due to previous versions of Python on your computer that already use the python command.


    Installing libraries

    Using the pip command, install the following libraries:

    • python -m pip install -user numpy matplotlib jupyterlab pandas squarify
    • bokeh geoplotlib seaborn


    Working with JupyterLab and Jupyter Notebook

    You can either download it using GitHub or as a zipped folder by clicking on the green Clone or download button on the upper-right side.

    In order to open Jupyter Notebooks, you have to traverse into the directory with your terminal. To do that, type:

    • cd Data-Visualization-with-Python/<your current lesson>

    For example cd Data-Visualization-with-Python/lesson01/

    To complete the process, perform the following steps:

    1. To reach each activity and exercise, you have to use cd once more to go into each folder, like so: cd Activity01
    2. Once you are in the folder of your choice, simply call jupyter-lab to start up JupyterLab. Similarly, for Jupyter Notebook, call jupyter notebook.


    Importing Python Libraries

    • Every exercise and activity in this course will make use of various libraries.


    Importing libraries into Python is very simple and here’s how we do it:

    1. To import libraries, such as NumPy and pandas, we have to run the following code. This will import the whole numpy library into our current file: import numpy # import numpy
    2. In the first cells of the exercises and activities of this courseware, you will see the following code. We can use np instead ofnumpy in our code to call methods from numpy: import numpy as np # import numpy and assign alias np
    3. In later lessons, partial imports will be present, as shown in the following code. This only loads the mean method from the library: from numpy import mean # only import the mean method of numpy
      Programma
      Data su richiesta

    Follow Up Courses

    Filtra
    • 3 Giorni
      Data su richiesta
      Price on Request
      Book Now
    • 3 Giorni
      Data su richiesta
      Price on Request
      Book Now
    • 5 Giorni
      Data su richiesta
      Price on Request
      Book Now
    • 5 Giorni
      Data su richiesta
      Price on Request
      Book Now
    • 3 Giorni
      Data su richiesta
      Price on Request
      Book Now
    • 4 Giorni
      Data su richiesta
      Price on Request
      Book Now
    • 5 Giorni
      Data su richiesta
      Price on Request
      Book Now
    • 5 Giorni
      Data su richiesta
      Price on Request
      Book Now
    • 4 Giorni
      Data su richiesta
      Price on Request
      Book Now
    • 2 Giorni
      Data su richiesta
      Price on Request
      Book Now

    Know someone who´d be interested in this course?
    Let them know...

    Use the hashtag #InsoftLearning to talk about this course and find students like you on social media.